Retail Economics Response - ONS Retail Sales August 2016
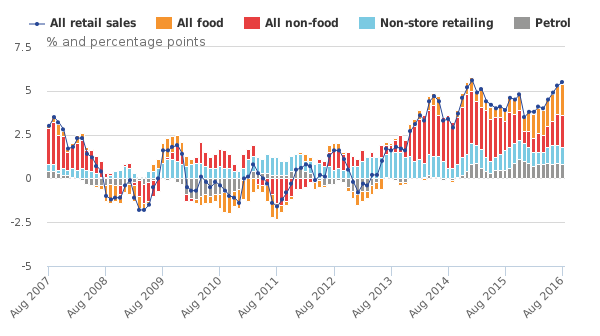
Retail sales growth (value, non-seasonally adjusted) rose by 3.8 per cent in August from 4.0 per cent in the previous month as consumers shrugged off any Brexit fears following the EU Referendum result, according to the ONS.The ONS figures remain stronger than the BRC who reported sales falling by 0.3 per cent on a comparable measure. These figures also fly in the face of other survey evidence provided earlier in the month from Visa who reported consumer spending rising by 0.1 per cent (volumes, seasonally adjusted) which compared to a rise of 6.2 per cent (volumes, seasonally adjusted) from the ONS. Granted, we’re not comparing apples with apples given the Visa measure includes spending components outside of retail. However, it was Recreation and Culture and Hotels, Bars and Restaurants which supported overall growth. The divergence between the measures boil down to differences in methodology, samples and revisions but, nevertheless, we think these latest figures are overly rosy and don’t reflect what we’re hearing anecdotally which portrays volatile and challenging trading conditions. • In August 2016, the quantity bought (volume) of retail sales is estimated to have increased by 6.2 per cent compared with August 2015; all store types except textile, clothing and footwear, and household goods showed growth with the main contribution coming from food stores.• The quantity bought decreased by 0.2 per cent compared with July 2016; the largest contribution to the decrease came from non-food stores which was offset by increases in non-store retailing, predominantly food stores and petrol stations.• The underlying pattern in the retail sector is still one of growth with the 3 month on 3 month movement in the quantity bought increasing by 1.6 per cent.• The amount spent (value) in the retail industry increased by 4.1 per cent compared with August 2015 and decreased by 0.5 per cent compared with July 2016.• The amount spent online increased by 18.5 per cent compared with August 2015 and increased by 0.4 per cent compared with July 2016.• Non-seasonally adjusted average store prices (including petrol stations) fell by 1.9 per cent in August 2016 compared with August 2015.
Figure 1 – Retail Sales Volume Growth by Components
Source: ONS
Back to Retail Economic News