ONS Labour Market March 2023
Eighth consecutive quarterly fall in vacancies
- The number of job vacancies in December 2022 to February 2023 was 1,124,000 – a decrease of 51,000 from September to November.
- The largest falls came from information and communication, manufacturing and professional, scientific and technical activities, which all fell by 9,000.
- On an annual basis, total vacancies decreased by 162,000 with falls in 15 of the 18 industry sectors. Information and communication experienced the largest fall (27,000).
- The total number of vacancies was 328,000 above the January to March 2020 pre-pandemic level.
Decline in retail employees
- Early payroll estimates for February show the number of payrolled employees rose by 684,000 employees compared to the previous year (up 2.3%).
- On the previous month, the number of payrolled employees rose by 98,000, or 0.3%.
- The largest yearly increase in payrolled employees continued to be driven by health and social work sector (a rise of 158,000 employees YoY), while the smallest was in the wholesale and retail sector (a fall of 31,000).
Inactivity declining
- The unemployment rate for November 2022 to January 2023 is largely unchanged compared with the previous quarter at 3.7%.
- In the quarter, the number of people unemployed for over a year increased slightly, while the number of people unemployed for up to six months and from six to twelve months were largely unchanged compared with the previous quarter.
- The economic inactivity rate decreased by 0.2pp on the quarter to 21.3% in November to January, declining largely among 16 to 24 year olds because they were students as well as those retired.
- Although declining, inactivity is 1.1pp above the pre-pandemic level and those inactive because they were long-term sick increased to a record high.
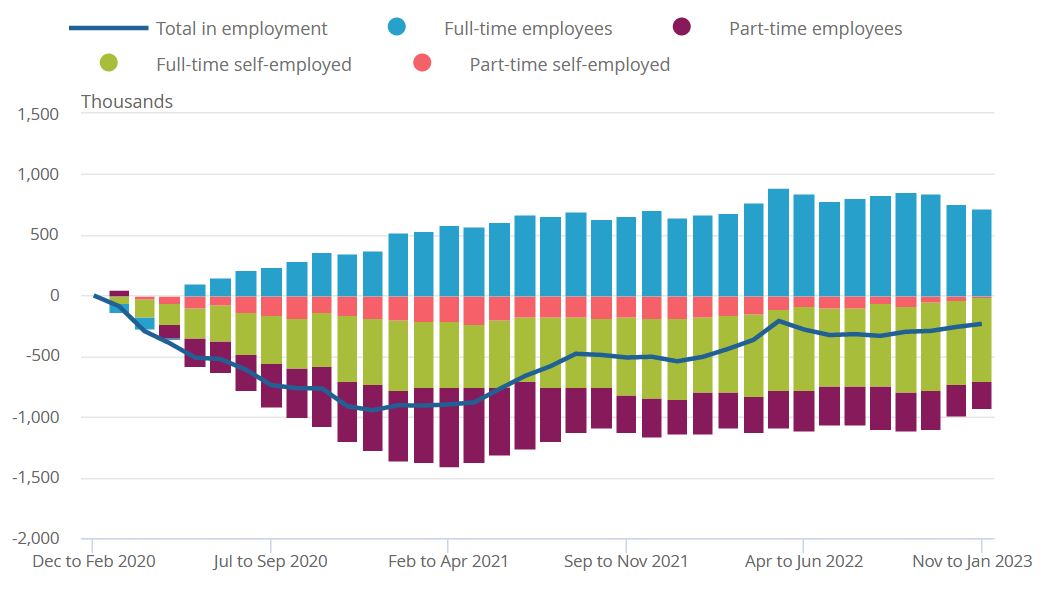
UK employees and self-employed workers, full-time and part-time workers aged 16 years and over, seasonally adjusted, cumulative change from December 2019 to February 2020, for each period up to November 2022 to January 2023

Source: Office for National Statistics
Employment rate edges up
- The employment rate for November to January rose 0.1pp in the quarter to 75.7% but is 0.8pp below pre-pandemic levels.
- The number of full-time employees decreased in November to January but remains above pre-pandemic levels, while the number of part-time employees increased in the three-month period.
Hours worked increases
- Total actual weekly hours worked increased by 7.3 million hours on the quarter to 1.04 billion hours in November to January.
- This is 9.5 million hours below pre-pandemic levels (December 2019 to February 2020), largely as a result of fewer people in employment.
- The increase in November to January was largely among women, whose actual weekly hours worked remain above pre-pandemic levels. Total actual weekly hours worked by men also increased but remain below pre-pandemic levels.
Real earnings decline
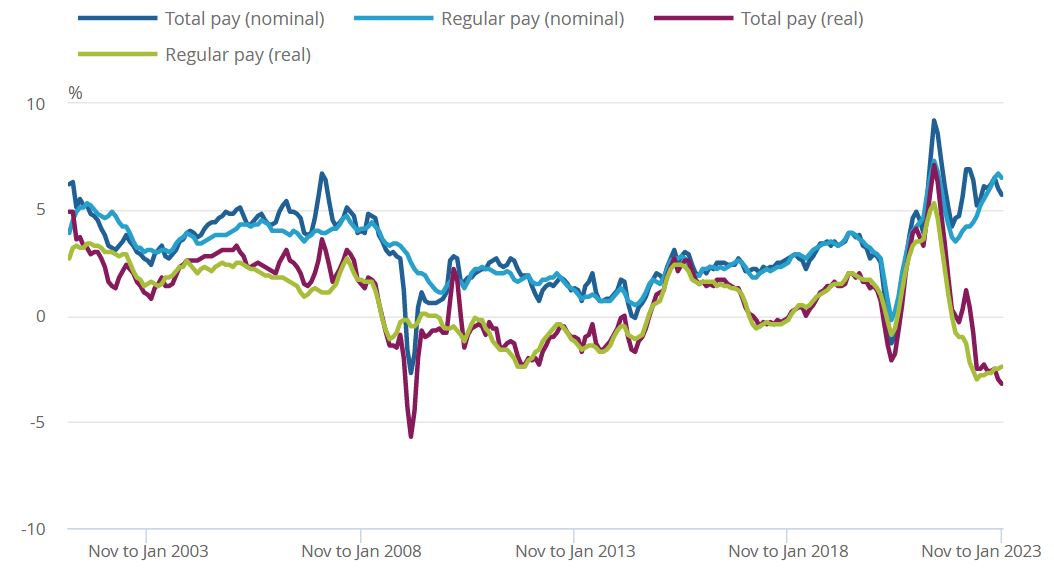
Both annual total and regular pay growth continued to lag inflation in the three months to January.
- In nominal terms, average regular pay (excluding bonuses) for employees in Great Britain was £589 per week before tax and other deductions from pay in January – up from £556 per week a year earlier.
- Average total pay (including bonuses) for employees in Great Britain was £630 per week before tax and other deductions from pay in January – up from £598 per week a year earlier.
- Regular pay rose by 6.5% and total pay by 5.7% in the three months to January compared to a year earlier.
- Average regular pay growth in the private was 7.0% in the three months to January, while the public sector pay rose by 4.8%.
- In real terms (adjusted for inflation), regular pay and total pay declined 3.2% and 2.4% YoY respectively in the three months to January. This remains among the largest falls in growth since comparable records began in 2001.
Average weekly earnings annual growth rates in Great Britain, seasonally adjusted, January to March 2001 to November 2022 to January 2023

Source: ONS
Back to Retail Economic News