Halifax House Price Index September 2021
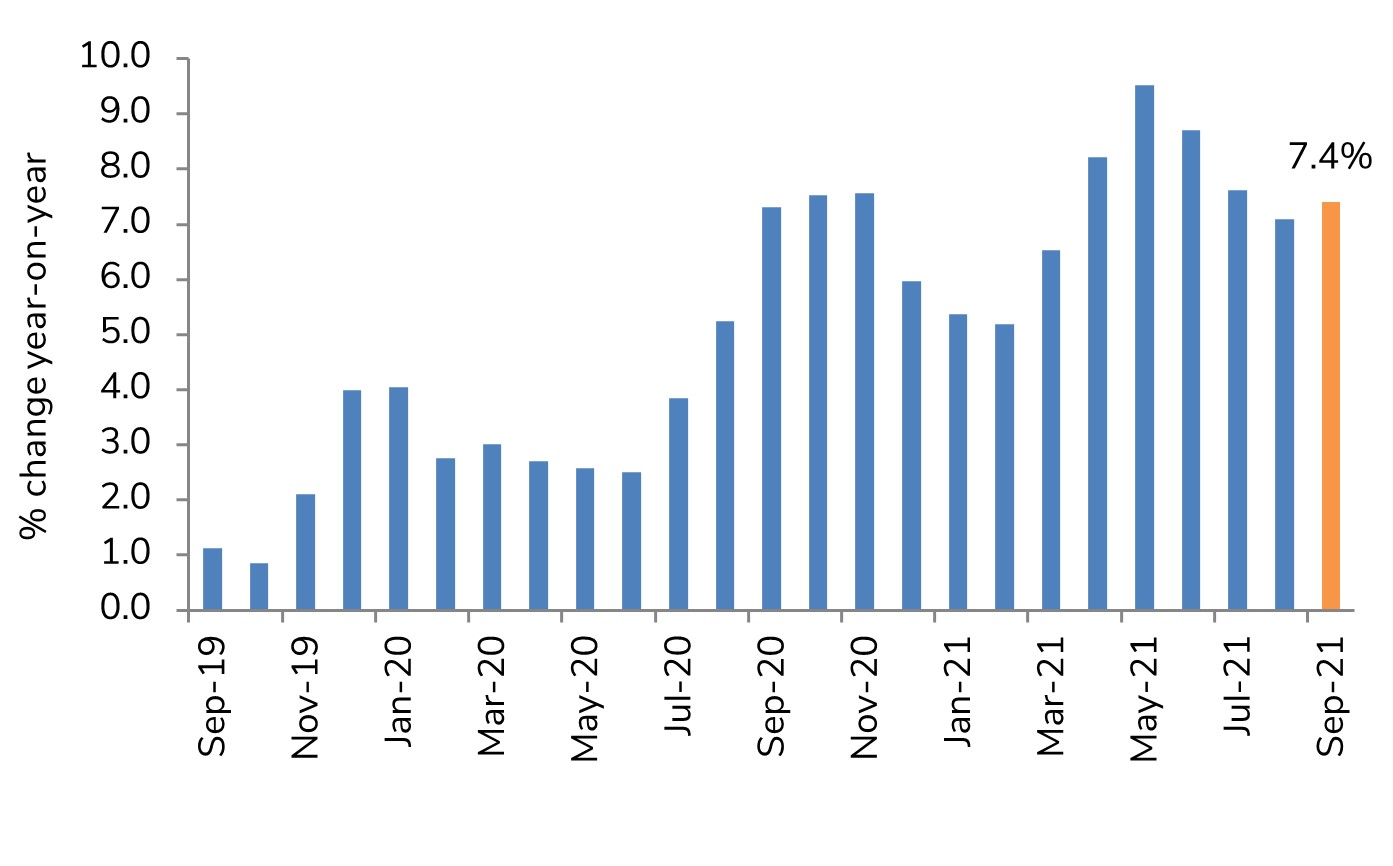
- UK house prices rose by 7.4% year-on-year (YoY) in September, and 1.7% month-on-month – the strongest monthly growth rate since 2007.
- This pushed average house prices to another record high, reaching just over £267,500.
- As a means of comparison, Nationwide reported that house prices accelerated by 10.0% year-on-year in September and 0.1% month-on-month.
Halifax house price index, year-on-year

Source: Halifax, IHS Markit
September marked the end of the stamp duty tax holiday in England – and a desire amongst homebuyers to close deals at speed – will have played a part in boosting these figures.
But it’s important to note that most mortgages agreed in September would not have completed before the tax break expired at the end of the month (residential purchases typically take 8-10 weeks for completion).
This shows that there are multiple factors driving house price growth including;
- Low borrowing costs
- Improving labour market - record vacancies, solid wage growth
- Limited supply of available properties - estate agents continue to report a decline in properties coming to market.
- Higher levels of involuntary savings - accumulated during lockdown periods, bolstering deposits for house moves
- ‘Race for space’ – work and lifestyle changes prompt search for more space. Over the past year, prices for flats are up just 6.1%, compared to 8.9% for semi-detached properties and 8.8% for detached.
Outlook
Despite the withdrawal of the stamp duty holiday, the five factors listed above will continue to provide upside support to housing market activity over the coming months – albeit not at the recent rate of price growth.
Against a backdrop of increasing pressures on the cost of living and looming tax rises, demand is expected to soften slightly heading into 2022, but overall, market fundamentals remain solid.
Regional breakdown
- Wales continues to record the strongest house price inflation of any UK region, with annual growth of 11.5% in September (£194,286 average price). Scotland also continues to outperform the UK average, with growth of 8.3% (£188,525 average price). Note that in both nations, the equivalent stamp duty holidays came to an end at an earlier date.
- The South West remains the strongest performing region in England, with annual house price growth of 9.7% (£276,226).
- The weakest performing regions are all to be found in the South and East of England, but these are also the regions with the highest average house prices. Eastern England has seen annual growth of 7.2% (£310,664) while in the South East it’s 7.0% (£360,795).
- Greater London remains the outlier, with annual growth of just 1.0% (£510,515) and was again the only region to record a fall in house prices over the latest rolling three-monthly period (-0.1%).
Back to Retail Economic News